What is the success of proposers when submitting a bill? In which phase of the legislative process are bills most frequently rejected? The analysts of KohoVolit.eu answer these and other questions using a unique visualization of the development of legislative pending publications – Sankey diagram.
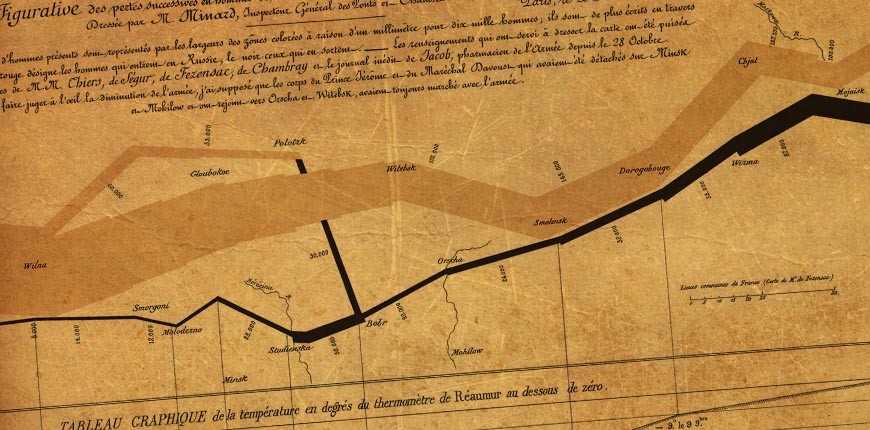
Sankey diagram is a famous developmental diagram, which visualizes a particular process using arrows or flows. The relative frequency of different types of outcomes of such process is presented by the width of the arrows. A memorable example of Sankey diagram is the visualization of Napoleon’s invasion of Russia, which demonstrates how his army diminished in time.
 Sankey diagram of Napoleon’s invasion of Russia. Author: Charles Joseph Minard.
The legislative process can be visualized in the same way. The passing of bills through particular phases is represented by colorful stripes, whose width reflects the number of bills that has already finished a specific phase. A bill can either go through all phases successfully or it can be eliminated out of the process, in case it is rejected or not approved, or its authorization may be uncompleted as a result of dissolution of the Parliament or one of its chambers.
This visualization can be demonstrated on the example of the Czech Parliament. It is a bicameral parliament, which consists of the Chamber of Deputies and the Senate. Besides these two chambers, the president also enters the legislative process. We will focus on the functional term of 2010-2013, when a relatively unexpected dissolution of the Chamber occurred. As a result, many pending parliamentary publications were left undiscussed.
The simplest Sankey diagram below shows the legislative process of proposals of the state budget. They are discussed only in the Chamber of Deputies and subsequently signed by the president. The Senate is not involved in the authorization, thus it is not displayed in the visualization. In the given functional term, only four state budget proposals were discussed. Three of them were authorized while one remained undiscussed due to the dissolution of the Chamber. ![]()
Sankey diagram of the discussion over state budget proposals in the Czech legislative process in the functional term of 2010-2013. The visualization was created using the javascript library d3.hs, Author: Kamil Gregor, KohoVolit.eu.
Particular steps of the legislative process are represented by white rectangles. A successful completion of a step is displayed by a green stripe, while an unsuccessful by a red one.
The visualization of all bills submitted by the government is a more complex example. The government in the functional term of 2010-2013 submitted more than half of all bills. The governmental bills generally have a higher chance of being passed, since the government is usually supported by most MPs in the Chamber of Deputies.
![]()
Sankey diagram of the discussion over bills in the Czech legislative process in the functional term of 2010-2013. The visualization was created using the javascript library d3.hs, Author: Kamil Gregor, KohoVolit.eu.
The Senate is included in this visualization, as it can amend or reject bills, which returns them back to the Chamber of Deputies, where they are voted over and they can be voted down. A bill can be returned to the Chamber by the president, as well. All such cases are represented by a yellow stripe. It is apparent that because of the Senate, in the given term, 89 bills from the total number of 160 were returned to the Chamber, while as for the president, it was 10 out of 234.
The government was quite successful when submitting bills. Only several governmental bills were rejected, and usually in the Chamber. However, many bills did not come through the legislative process because the Chamber was dissolved.
If we take a look at other bills that were submitted by MPs, the Senate or local governments, we can see a very different image. The visualization includes one more step – the expression of the government. The government, naturally, comments only on bills that were not submitted by it.
![]()
Sankey diagram of the discussion over bills that were submitted by individual MPs, groups of MPs, the Senate and local governments in the Czech legislative process in the functional term of 2010-2013. The visualization was created using the javascript library d3.hs, Author: Kamil Gregor, KohoVolit.eu.
It is obvious that these bills had a lesser chance of success than the governmental bills. Usually, they were declined with the first reading in the Chamber, which is actually the first opportunity to vote over a bill. Most of these bills were submitted by the opposition MPs, so they lacked broader support.
However, if a bill successfully left the Chamber, it was quite safe. This was due to the fact that in the functional term of 2010-2013, the Senate and the president tended to favour the opposition so they had no interest in recommitting these bills.
If you want to learn more about the visualization of the legislative process using the Sankey diagram or if you want to create similar visualizations, do not hesitate to contact us.