The analysts of KohoVolit.eu come up with unique maps that present election results more closely from a human perspective. Thanks to them, you can easily get an overview of where the voters of various political parties and candidates are located.
Election results are often demonstrated in a map. However, the media usually do not utilize the full potential of election maps. For example they only show, which party or candidate gained most votes in each region.

A shot from the programme “Election 2013”, a special show prepared by the Czech television for the election to the Chamber of Deputies in 2013. The map shows the winning party in each region.
At first glance, there is a fundamental defect – the regions are too large and there is relatively only a few of them. This scale is rather inadequate for a good visualization of the distribution of voters of parties or candidates.It is better to create a map displaying the winning party or candidate in a higher number of smaller territories, for example in municipalities.

A screenshot of the map of winning parties in each municipality in the Czech election to the Chamber of Deputies in 2013, created by the news server iHNED.cz.
Even this way of displaying election results has a principal weakness – in order for a municipality to be colored in the color of the winning party, it is sufficient that a party wins only by a one single vote. A particular municipality could not therefore be distinguished from another one, where the same party gained 100% votes!
Rather than displaying the winning parties it is thus more favorable to depict in the map only the voters of one party and use the color to highlight the proportion of voters for that specific party. In a similar way, maps of turnout or other quantities not necessarily related to election, are created.

Map showing the turnout in the first round of the Czech presidential election of 2013. The map was created using QGIS programme. Author: Karel Komínek, KohoVolit.eu.
Another problem is that the size of municipalities in the map does not correspond with its population at all. Vaster municipalities can therefore seem, to an untrained eye, more important than they actually are. For example, a military area called Hradiště in the municipality of Karlovy Vary had only 430 of voters in the Czech election to the Chamber of Deputies in 2013, while Prague, having a similar size, had more than 900 000 of voters.
![]()
Infographics showing the difference between the area and the number of voters in two municipalities during the Czech election to the Chamber of Deputies in 2013. You can switch between the area and the number of voters using buttons in the upper part of the infographics. The infographics was created using application Infogr.am. Author: Kamil Gregor, KohoVolit.eu.
Luckily we can create a map,where the symbol size for a territorial unit (for example a municipality) corresponds with the number of voters, not the area. We can consequently demonstrate the winning party or candidate using colors.
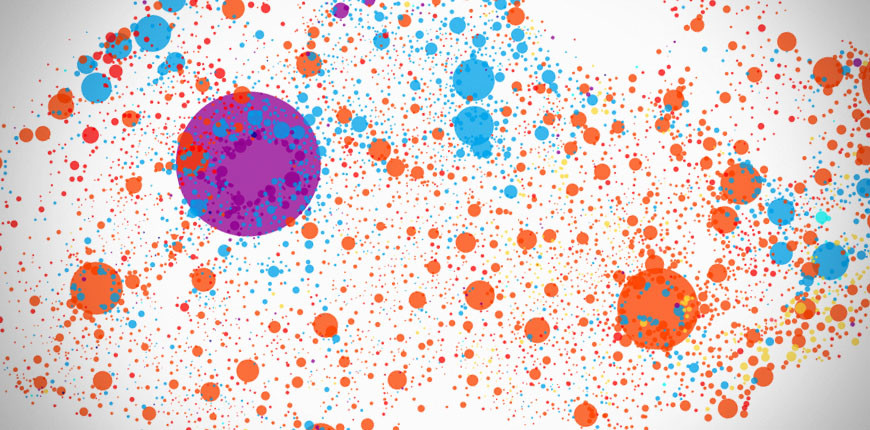
![]() Map showing the winning party in municipalities during the Czech election to the Chamber of Deputies in 2013. The size of municipalities corresponds with the amount of valid submitted votes there. After mouse movement, the name of the municipality and the number of submitted valid votes appears. The visualization was created using javascript library d3.js. Author: Michal Škop, KohoVolit.eu.
Map showing the winning party in municipalities during the Czech election to the Chamber of Deputies in 2013. The size of municipalities corresponds with the amount of valid submitted votes there. After mouse movement, the name of the municipality and the number of submitted valid votes appears. The visualization was created using javascript library d3.js. Author: Michal Škop, KohoVolit.eu.
We have already demonstrated that displaying the winning parties is not very informative, because in order for a municipality to color in the map, it is sufficient that a party wins only by a single vote.
Rather than displaying the winning parties it is therefore more favorable to demonstrate the differences in the number of votes between two parties or candidates. The size of the circle in such map does not correspond with the number of valid votes in a municipality, but with the difference in the number of votes for two parties or candidates, which we select.
![]() Color of municipalities showing the winning candidate in the run-off of the Czech presidential election of 2013. The size of municipalities corresponds with the difference in the number of votes for each of the two competing candidates. After mouse movement, the name of the winning candidate and the difference in the number of submitted votes appear. The visualization was created using javascript library d3.js. Author: Michal Škop, KohoVolit.eu.
Color of municipalities showing the winning candidate in the run-off of the Czech presidential election of 2013. The size of municipalities corresponds with the difference in the number of votes for each of the two competing candidates. After mouse movement, the name of the winning candidate and the difference in the number of submitted votes appear. The visualization was created using javascript library d3.js. Author: Michal Škop, KohoVolit.eu.
The information about the number of voters in a municipality and the difference in the number of submitted votes between two parties or candidates can be merged into one map by replacing the circle by a “donut”. The size of a “donut” corresponds with the number of all valid votes in a municipality and the thickness of a “donut” indicates the difference in the number of submitted votes for two parties or candidates.
![]() Color of municipalities showing the winning candidate in the run-off of the Czech presidential election in 2013. The size of the “donut” corresponds with the number of valid submitted votes in a municipality and the thickness of a “donut” indicates the difference in the number of votes for two competing candidates in a municipality. After mouse movement, the name of the winner and the proportion of votes for both candidates appear. The visualization was created using javascript library d3.js. Author: Michal Škop, KohoVolit.eu.
Color of municipalities showing the winning candidate in the run-off of the Czech presidential election in 2013. The size of the “donut” corresponds with the number of valid submitted votes in a municipality and the thickness of a “donut” indicates the difference in the number of votes for two competing candidates in a municipality. After mouse movement, the name of the winner and the proportion of votes for both candidates appear. The visualization was created using javascript library d3.js. Author: Michal Škop, KohoVolit.eu.
Such map does not have to demonstrate only the difference in the number of votes between two parties or candidates. In addition, it can also inform us about how many votes in a particular municipality were missing or, on the contrary, were superfluous for a party or a candidate in relation to a definite limit, that we set.
![]() Color of municipalities in the map showing whether the liberal-conservative party ODS gained more than 5% of votes (blue) or less than 5% of votes (red) in particular municipalities during the Czech election to the Chamber of Deputies in 2013. The size of the “donut” stands for the number of all valid votes in a municipality and the thickness of the “donut” indicates the difference between the votes for ODS and 5% of all valid votes. The visualization was created using javascript library d3.js. Author: Michal Škop, KohoVolit.eu.
Color of municipalities in the map showing whether the liberal-conservative party ODS gained more than 5% of votes (blue) or less than 5% of votes (red) in particular municipalities during the Czech election to the Chamber of Deputies in 2013. The size of the “donut” stands for the number of all valid votes in a municipality and the thickness of the “donut” indicates the difference between the votes for ODS and 5% of all valid votes. The visualization was created using javascript library d3.js. Author: Michal Škop, KohoVolit.eu.
The map of electoral support can be based on either a general or a physical map. This will facilitate the identification of component territorial units, particularly for users, which are not very familiar with the displayed areas.
![]() Map showing the electoral support for candidates in the second round of the 2013 election to local councils in the region of Banská Bystrica in Slovakia. The size of bubbles corresponds with the number of voters in a municipality, the color demonstrates the winning candidate and the color intensity stands for the lead of the winning candidate (the more intensive the color, the greater the lead). Clicking on the bubble reveals more information. Created using javascript library d3.js. Author: Michal Škop, KohoVolit.eu.
Map showing the electoral support for candidates in the second round of the 2013 election to local councils in the region of Banská Bystrica in Slovakia. The size of bubbles corresponds with the number of voters in a municipality, the color demonstrates the winning candidate and the color intensity stands for the lead of the winning candidate (the more intensive the color, the greater the lead). Clicking on the bubble reveals more information. Created using javascript library d3.js. Author: Michal Škop, KohoVolit.eu.
Our election maps are, among others, used by data journalists, for example during the Czech presidential or parliamentary election or during the Slovakian regional election in 2013.
Spatial concentration and autocorrelation
The distribution of voters in the space may also be displayed differently than using maps. For example, it is interesting to observe, how the proportion of votes for a party or a candidate changes in differently sized groups of municipalities. In fact, some parties or candidates have more urban voters, while others gain support predominantly in the country. And sometimes the distribution of votes is, among differently sized municipalities, almost the same.
![]() Graph showing the average proportion of votes for three candidates in the first round of the Czech presidential election in 2013 in municipalities according to their size. The capital Prague with its more than 1.3 million inhabitants is by far the biggest municipality of the Czech Republic. You can switch among the candidates by clicking on the buttons in the upper part of the infographics. The infographics was created using application Infogr.am. Author: Kamil Gregor, KohoVolit.eu.
Graph showing the average proportion of votes for three candidates in the first round of the Czech presidential election in 2013 in municipalities according to their size. The capital Prague with its more than 1.3 million inhabitants is by far the biggest municipality of the Czech Republic. You can switch among the candidates by clicking on the buttons in the upper part of the infographics. The infographics was created using application Infogr.am. Author: Kamil Gregor, KohoVolit.eu.
Furthermore it is possible to observe, whether voters of a party or a candidate concentrate in specific areas. The rate of the spatial concentration can be expressed by a numeric indicator, which is called Gini index. It is derived from economics, where it is used to measure the distribution of wealth in the society. Gini index attains values from 0 to 1. The value 0 corresponds with the situation when voters are perfectly distributed in a specific area, which means that the proportion of votes for a particular party or candidate is the same in each municipality. The value 1 indicates that all voters of a party or a candidate or located just in one single municipality.
![]() Graph showing the Gini index of votes proportion for candidates in the first round of the Czech presidential election of 2013 in municipalities. The infographics was created using the application Infogr.am. Author: Kamil Gregor, KohoVolit.eu.
Graph showing the Gini index of votes proportion for candidates in the first round of the Czech presidential election of 2013 in municipalities. The infographics was created using the application Infogr.am. Author: Kamil Gregor, KohoVolit.eu.
Another interesting quantity is so-called Moran’s I, which measures spatial autocorrelation. It tells to what extent is the electoral support for a party concentrated in one continuous territory. A political party that has support with a low rate of Gini index and Moran’s I, has voters more or less evenly distributed in the entire area of the state. In case that Gini index of a party is high but the Moran’s I remains low, it means that the voters of this party are concentrated in a few areas, which are not adjacent.
Conversely, if the Gini index is low and Moran’s I is high, then the electoral support for a party is quite evenly distributed in space, however small deviations are concentrated in one or a few regions. The high value of both indicators implies the situation when a party gains almost the entire electoral support in one undivided territory.
![]() Graph showing the Gini index, Moran’s I and the proportion of votes for political parties that took part in the Czech election to the Chamber of Deputies in 2013 in all regions. Both indicators were calculated from the vote proportion in municipalities and districts of Prague. After mouse movement the abbreviation of a party appears. A particular party can be selected in the right menu. The graph was created using Google Drive tool. Author: Kamil Gregor, KohoVolit.eu.
Graph showing the Gini index, Moran’s I and the proportion of votes for political parties that took part in the Czech election to the Chamber of Deputies in 2013 in all regions. Both indicators were calculated from the vote proportion in municipalities and districts of Prague. After mouse movement the abbreviation of a party appears. A particular party can be selected in the right menu. The graph was created using Google Drive tool. Author: Kamil Gregor, KohoVolit.eu.
If we apply the spatial analysis of election results using Gini index and Moran’s I on the Czech election to the Chamber of Deputies in 2013, we will find out that the populist party ANO had quite a low value of Gini index and Moran’s I. If we carry out its electoral support to the map, we can clearly see that the voters of this party were evenly distributed in the entire territory of the state.  Map showing the electoral support for the populist party ANO in the Czech election to the Chamber of Deputies in 2013. The colorful scale is divided into ten parts, which capture equally wide intervals. The map was created using the GeoDa programme. Author: Kamil Gregor, KohoVolit.eu.
Socialist NS-LEV 21 party had an extremely high value of Gini index in this election, which means that the electoral support to a certain extent came only from a very limited number of municipalities. The value of Moran’s I for this party was low, as well, because the municipalities were not adjacent.

Map showing the electoral support for the socialist NS-LEV 21 in the Czech election to the Chamber of Deputies in 2013. The colorful scale is divided into ten parts, which capture equally wide intervals. The map was created using the GeoDa programme. Author: Kamil Gregor, KohoVolit.eu.
It is interesting to compare the Pirate party and the Christian-democratic KDU-ČSL. Both of these parties had a similar value of Gini index, there voters were therefore concentrated in a similar extent. However, they differ in the value of Moran’s I. Pirates had a low value because their voters were concentrated in large quantities in mutually non-adjacent units, particularly in big cities. On the contrary, the KDU-ČSL party’s high rate captures the fact that it’s voters were concentrated in a lower quantity in compact territories, mainly in southern Moravia.

Map showing the electoral support for the liberal Pirate Party in the Czech election to the Chamber of Deputies in 2013. The colorful scale is divided into ten parts, which capture equally wide intervals. The map was created using the GeoDa programme. Author: Kamil Gregor, KohoVolit.eu.

Map showing the electoral support for the Christian-democratic party KDU-ČSL in the Czech election to the Chamber of Deputies in 2013. The colourful scale is divided into ten parts, which capture equally wide intervals. The map was created using the GeoDa programme. Author: Kamil Gregor, KohoVolit.eu.
Cartograms of mandate distribution
Apart from the number of votes, we can also clearly display even the distribution of mandates among parties. The so-called cartogram serves as a tool for this. Every constituency (or every region in the case of the Czech Republic) can be depicted in such cartogram, as a cluster of squares, with the number of squares corresponding with the number of mandates that are allocated to a certain region.
 Cartogram of mandate distribution for political parties in the Czech election to the Chamber of Deputies in 2013. Author: Petr Gongala, Masaryk University.
In case you want to know more about displaying election results or you wish to create similar visualizations, do not hesitate to contact us.